The Road Safety box is constantly recording data about your vehicle, and it’s of the utmost importance to be able to understand all of this recorded information. Recognizing troublesome data points and identifying trends can help you ensure the safety of your patients and crews, as well as ensure the longevity of that $200,000 truck out on the road. Let’s take a second to talk about what signs to look out for and how to dig down into the data to find the underlying problem.
Assess Your Company Driver Levels
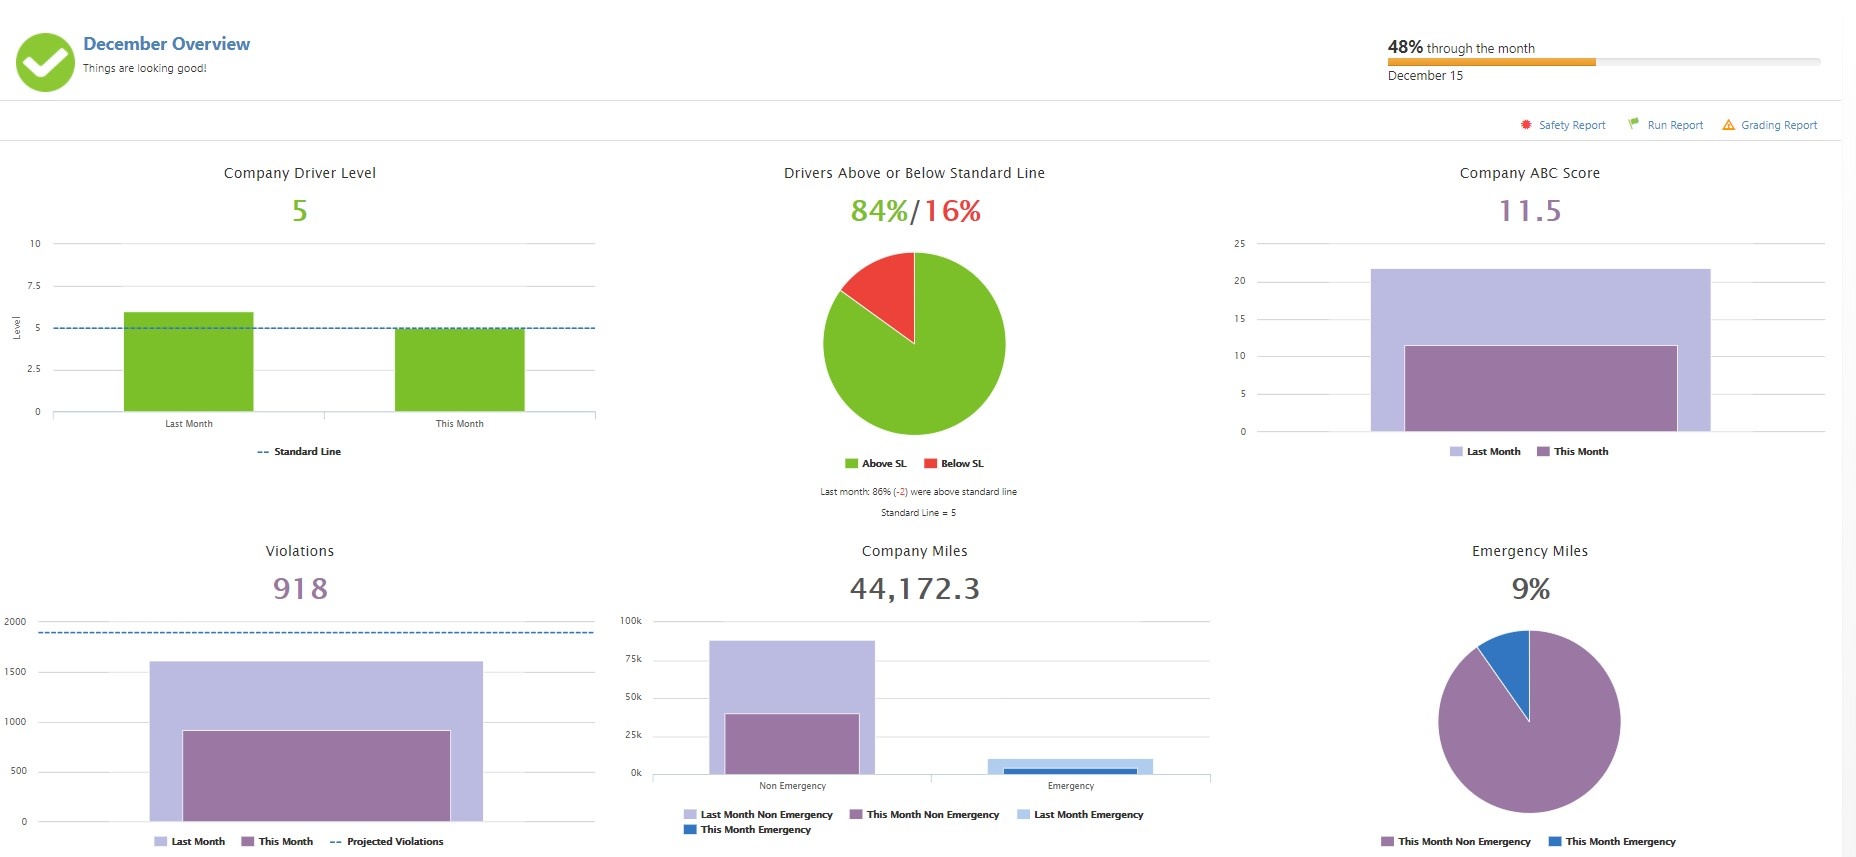
When you log into Road Safety on ZOLL Online, you’re greeted by the Monthly Overview Dashboard, which gives you a general overview of how your operators are doing this month and compares that data to the previous month. The first thing that commanded my attention on the picture below is the Company Driver Level, because I can easily see that my Company Driver Level is one point lower than the previous month. It’s still technically above the standard line, but I want to nip in the bud any bad driving behavior before that Company Driver Level goes down any further. You always should be progressing, not regressing, right?

My next step is to figure out WHY my Company Driver Level has gone down, so I click into my Safety Report link in the upper right hand corner; the Safety Report will allow me to see the total number of individual violations that my operators have been racking up this month. In the snapshot below, I’ve sorted the report to first show the lowest scoring drivers, and I’ve zeroed on David Johnson and Katie Smith. Katie has a large number of over forces and a relatively small amount of miles (70.3), while David has a larger amount of miles (317.8) and a mixture of over speed and over force violations. Right off the bat, I can tell that Katie seems to have a problem with over forces because she has a much higher count than anyone else on the page, besides Unknown Driver, and even more than David who has 4.5 times the amount of miles as she does. David, on the other hand, has more over speed violations than anyone else on the page. I’m going to dig into both of the drivers, but let’s begin with Katie.

Over Force Violations
To begin the dive, I open up the Drivers Dashboard and click on Katie’s name in the driver list to be taken to Katie’s specific Driver Dashboard, I can click into the Run Report, so that I’m taken to the month-to-date Run Report. I could’ve also created a new report for Katie, but this is faster. Looking at Katie’s Run Report, I can tell that Katie doesn’t drive much, with the exception of this one long run that had a ton of over forces. For a map-based view of this run, I can click into the Run Analysis Map, and there I can see that she incurred a ton of violations while she was seemingly going through parking lots. The picture below is a zoomed in section of the Run Analysis Map, and the red sections of the green route are over force violations.

There are a good number of other over forces throughout this run that happened in the same fashion. This is weird, so I’m going to follow up with Katie so we can chat about what was going on during this particular run. Katie’s driving lacks the repetitive nature to be classified as a trend, but it makes me a little nervous that she’s driving like this when she does get behind the wheel.
Over Speed Violations
Turning over to David Johnson, I am going to focus in on his Over Speed violations to see if this is a pattern or a one-time occurrence. I’m going to set my Run Report filters to show only David’s runs, and I can see that for this month, David has one run with 10 violations (five over speeds and five extreme over speeds), and the two other runs had two over forces.

Much like Katie, David doesn’t show a repetitive nature of pushing the Road Safety envelope, but instead shows that when they’re getting violations, they tend to all pile up on the same run. Clicking into the Run Map Analysis for David’s “bad run” we can see that this was a longer run where he was running non-emergent on the highway for an extended period of time. The violations were extremely short, so he quickly corrected his speed, which is a good thing, but he was still pushing the over speed and extreme over speed boundary multiple times through the run.

If I wanted to go even further with this, I could go into my dispatch records to see what call David was on at this point. He wasn’t emergent during this run based on Road Safety data, but my agency has made it a priority to minimize lights and sirens as much as possible, and David may have slipped up a few times in trying to get to the scene quickly while still complying to the Road Safety constraints. On the other hand, he did get one more over speed on return trip, and it doesn’t appear he transported the patient anywhere, so maybe we do need to sit down with David and chat about the necessity of him and his truck actually making it to and from each incident. He might not be away that even going just 0.62 mph over the speed limit increases his risk of a crash by 3 percent.
What Does Your Data Tell You?
In digging down into my Road Safety data, we’ve found that my agency doesn’t have a swath of bad drivers who are habitual violators of Road Safety protocols, but instead we have a handful of drivers who have one or two bad runs. This may seem positive, but that one bad run can be the difference between a regular day and a day where we write out a $50,000 check for being found at-fault. Knowing how to get to the bottom of your data can help you identify these problem areas before they become more troublesome trends.