One of the largest fire departments in the United States, the Los Angeles (LA) County Fire Department has 174 fire stations, 73 paramedic squads and many more paramedic assessment units. It services an area of 2,300 square miles that includes all unincorporated parts of LA County and 58 contract cities, all of the county’s beaches except Long Beach, and Catalina Island. It even includes air operations, with eight helicopters – three are in service at one time with a fourth in reserve. In 2016, LA County Fire Department’s call volume was approximately 350,000. Of those calls, 300 to 350 calls per month are for cardiac arrest. How could CPR performance and patient outcomes improve if the fire department started collecting and analyzing data on those calls?
When it Comes to CPR Outcomes: You Can’t Manage What You Don’t Measure
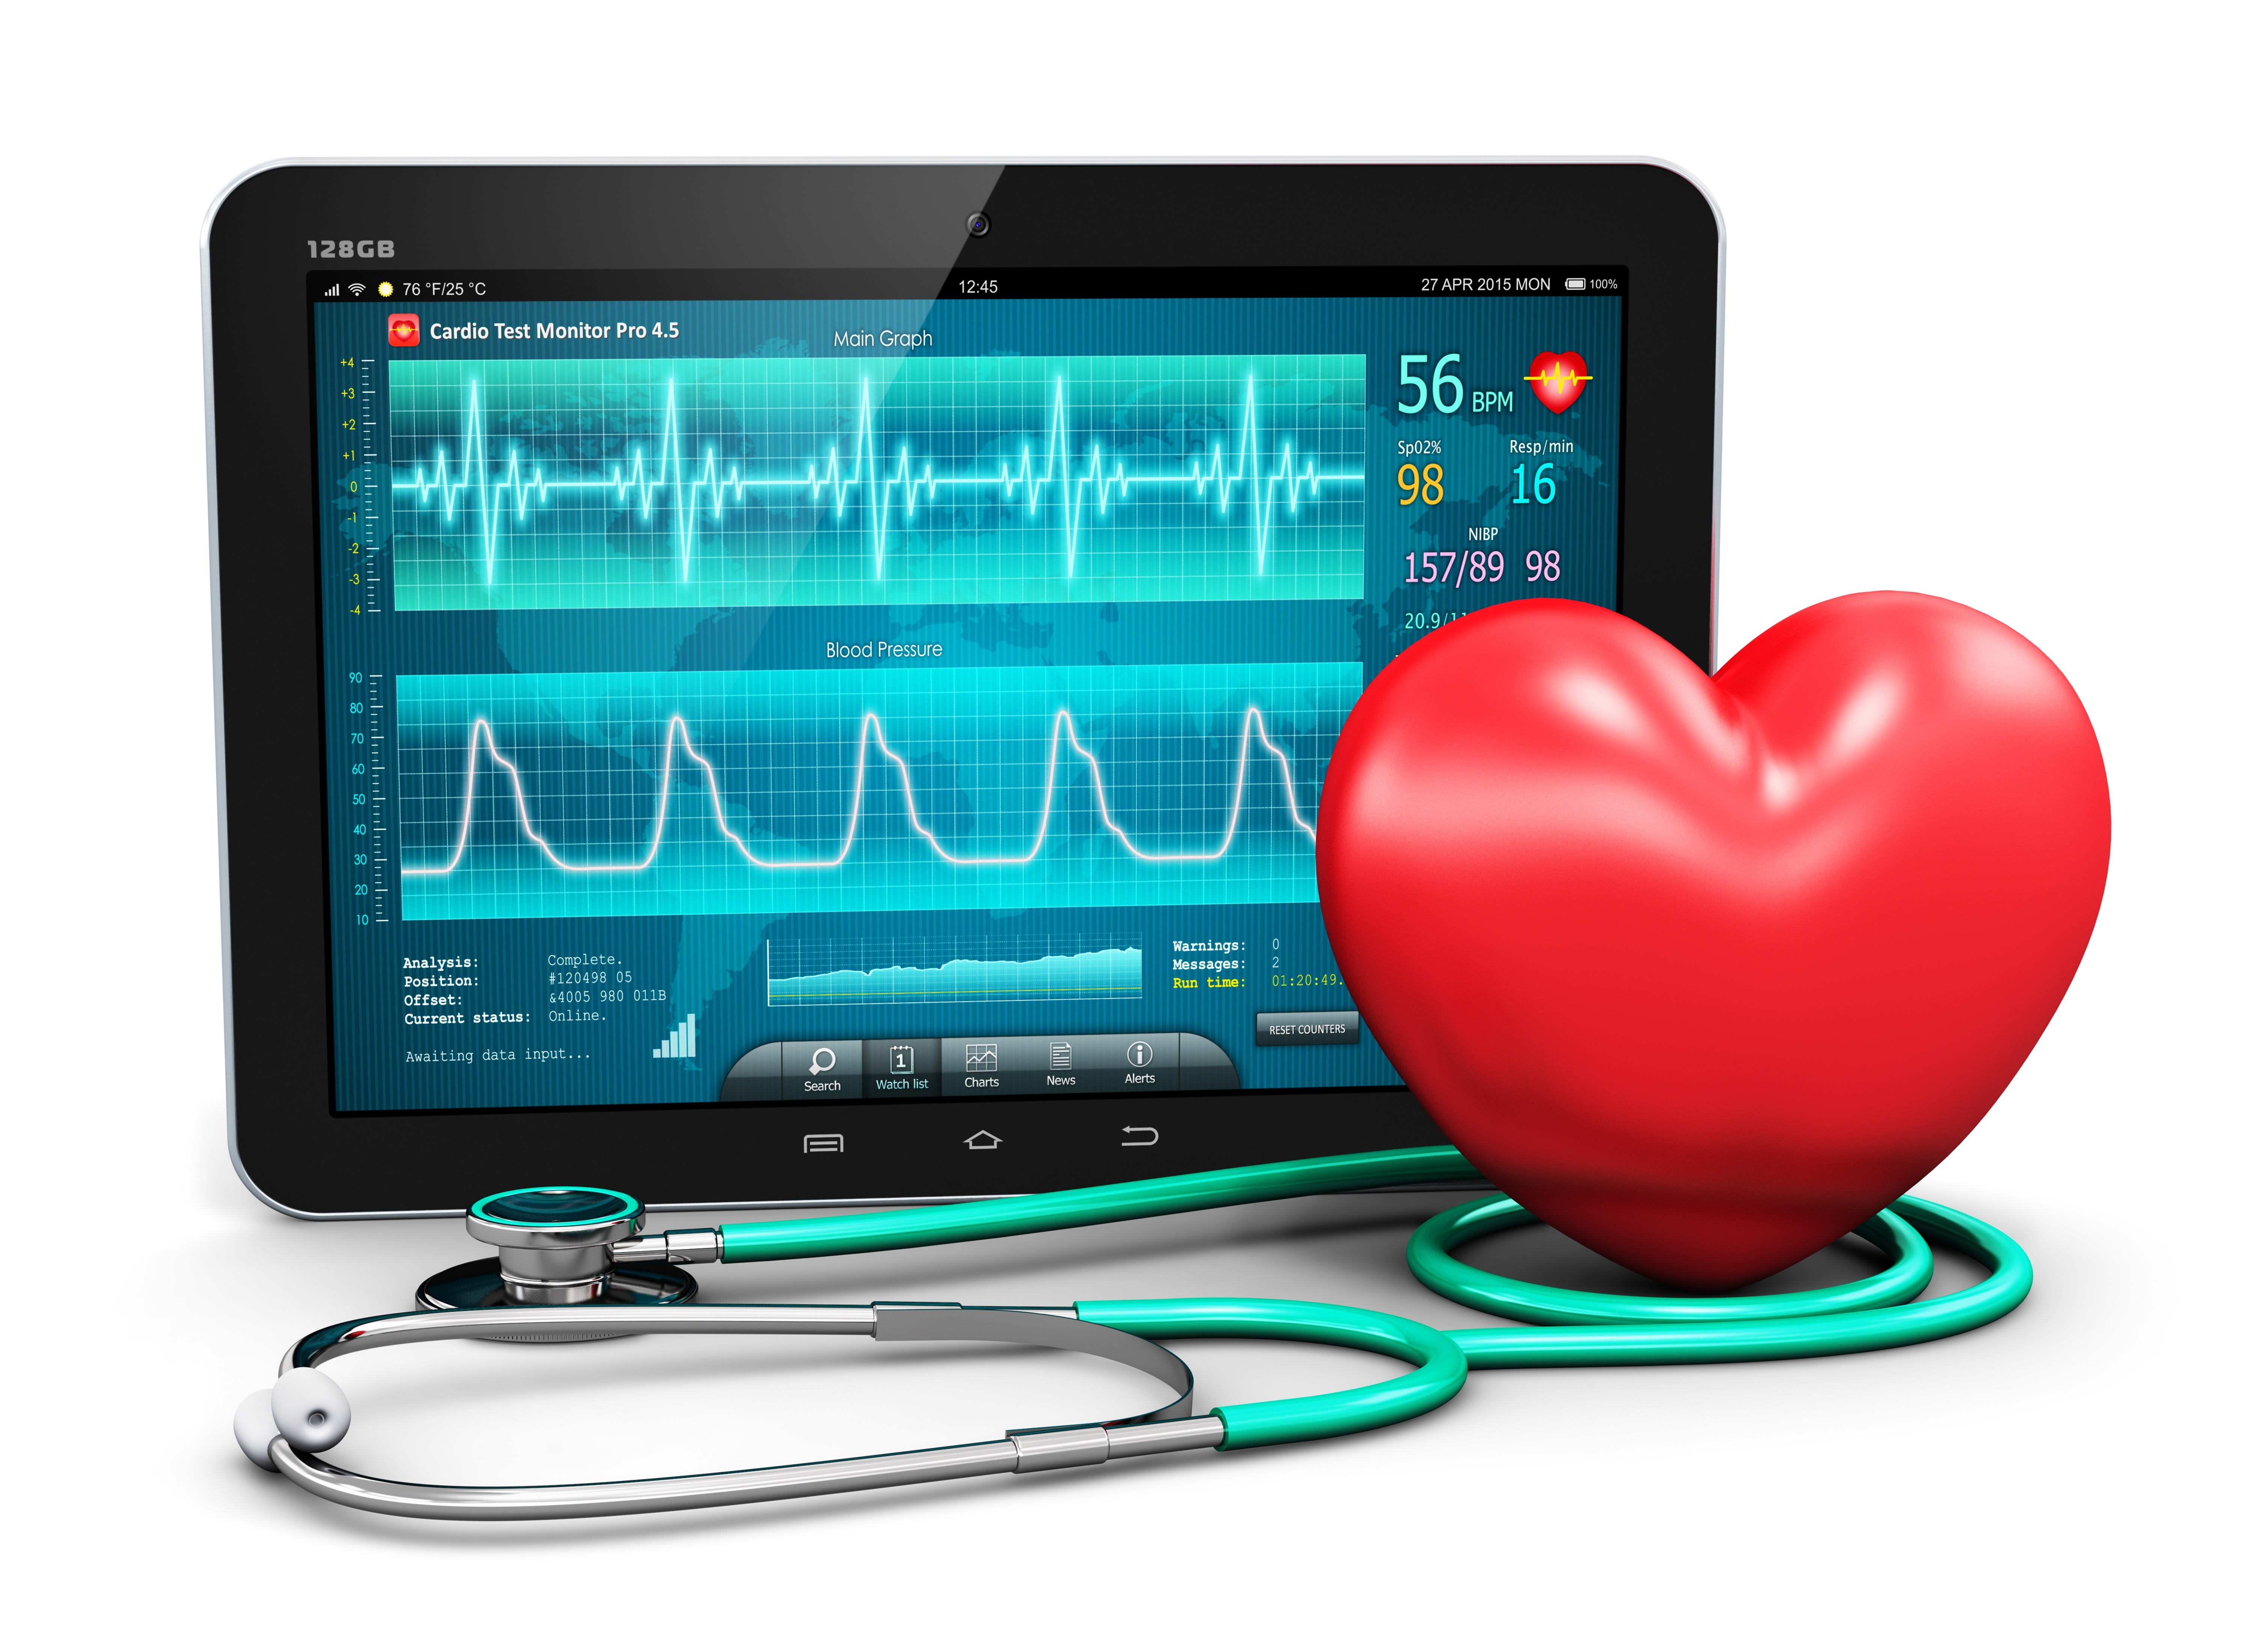
In 2015, with the addition of the ZOLL X Series monitor, LA County Fire Department increased its efforts in data collection, measurement and analysis as part of a major quality improvement initiative for cardiac arrest. They then changed their CPR feedback software to RescueNet CaseReview from ZOLL, which provided an intuitive platform for data analysis. This marked LA County Fire Department’s first effort to analyze the quality of resuscitation, rather than just the outcome. The initial data gathered in December 2015 showed significant opportunities for improvement across most measures. It was apparent crews needed additional training and support in order to achieve evidence-based goals. The average compression depth was 1.8 inches (American Heart Association (AHA) recommends 2 to 2.4), and the average rate was 128 compressions per minute (AHA recommends 100 to 120).
Read: Taking a Deep Look at the Guidelines for CPR
Rather than jump to labor intensive changes across such a large department, they decided to do a 30-day proof-of-concept pilot study at five of their fire stations. They focused their education on two major points: average depth and average rate of compressions. Each shift at each station received a 20-minute tabletop discussion about the outcome benefits of each parameter, a description of how they are measured, and they had the voice prompts and a metronome turned on their monitor to help with depth and rate of compressions. What was the result? “We doubled compliance with depth and tripled compliance with rate in those five stations compared to the others,” said Dr. Clayton Kazan, Medical Director for the LA County Fire Department. “We then used the results from our pilot study to train the rest of the department throughout 2016.”
“This marked LA County Fire Department’s first effort to analyze the quality of resuscitation, rather than just the outcome.”
In order to improve their data collection and analysis, LA County Fire Department also hired a quality assurance (QA) nurse with the goal to accomplish 100 percent case review. Currently, they are now analyzing 100 to 120 cardiac arrest calls each month.
Follow these 3 System of Care Steps for CPR QA/QI
“There are three critical steps for developing a successful system of care to improve quality assurance and improvement of CPR,” Kazan said. He believes developing systems of care involves similar steps regardless of the facet of care you are working on. “Developing systems of care isn’t unique to EMS; performance improvement is industry agnostic,” Kazan said. If you want to build a system that is successful, follow these three steps:
- Lead with the why. Avoid this being “just another way your crews are being measured.” Show the crews the value in what you are measuring. In terms of cardiac arrest, these measurements are all associated with higher survival rates in cardiac arrest patients. When you explain that making these improvements leads to more cardiac arrest patients walking out of the hospital, it’s hard to fight to maintain the status quo.
- Make the changes you want as simple and automatic as possible. The more steps that have to be remembered and the more difficult the process, the more problems you will have with compliance. In LA County Fire Department’s case, they set their metronome and voice prompts to be automatic when defibrillator pads are applied to simplify the process. Nothing new needs to be turned on or remembered.
- Provide real-time feedback and ongoing education. Never forget to close the loop for the crews; or else improvements will not be sustained. Give feedback to crews as early as possible about how they are performing. “By showing and explaining the data to our crews, we saw a huge outcome improvement.” Don’t forget to link performance improvement to actual patient outcomes. “People usually fail to come full circle to share end results with the user. Share the positive stories that sustain your gains. Show the impact of what people are doing,” Kazan said. As a large department, they have huge amounts of data to follow, but also have the benefit of a large education team. Make sure that your educators are included in your data analysis, so they can recognize the high performers and target education to the lower performers to move them up.
*This article was originally published in February 2017